


ABC/XYZ Analysis

What Is ABC/XYZ Analysis?
ABC/XYZ analysis is one of the most widely used methods for evaluating the objects that impact the profitability and growth of a business. It is a cross-method that integrates two approaches: ABC analysis and XYZ analysis. This method classifies objects based on their influence on the company's profits and overall success.
The primary distinction between ABC and XYZ analysis lies in the objects they assess. ABC analysis follows the Pareto Principle, which states that 20% of efforts lead to 80% of results. Thus, objects - whether products or business clients - are divided as follows:
-
Category A: 20% of objects are the most valuable, contributing to 80% of the profit.
-
Category B: These are intermediate objects, accounting for about 30%, which contribute to 15% of the profit.
-
Category C: The least valuable objects, which make up 80% of all items, generate only 5% of the profit.
XYZ analysis classifies objects by the frequency of their use rather than the profit they generate. For example, it is used to examine fluctuations in demand. Category X includes objects whose demand does not change by more than 10% per month. Category Y includes objects with fluctuations from 10 to 25%, and category Z - with fluctuations greater than 25%, that is, the most unpredictable or dependent on external circumstances. By combining the results of both analyses, objects can be grouped into nine categories:
-
AX: High profit share and stable demand.
-
AY: High profit share but fluctuating demand.
-
AZ: High profit share but unpredictable demand.
-
BX: Moderate profit share with stable demand.
-
BY: Moderate profit share but fluctuating demand.
-
BZ: Moderate profit share and unpredictable demand.
-
CX: Low profit share and stable demand.
-
CY: Low profit share with fluctuating demand.
-
CZ: Low profit share and unpredictable demand.
The intersection of ABC and XYZ analysis enables businesses to identify the least profitable items or those with the most erratic demand, allowing them to consider discontinuing such items. Conversely, it helps highlight the most valuable and stable products, which should be targeted in marketing efforts. Using ABC and XYZ together provides a more comprehensive and objective understanding of the product portfolio, as using them separately may offer incomplete insights.
What Can ABC/XYZ Analysis Be Used For?
ABC/XYZ analysis is especially useful for analyzing the product assortment of brands or stores with large inventories, particularly when there is a need to update product offerings, optimize warehouse space, or reduce production, purchasing, promotion, and partnership costs. It is important, however, to ensure the comparison involves similar objects. For example, it is not appropriate to compare an item that has been on the market for a long time with a newly launched product, nor should everyday items be compared to seasonal products, as the latter is designed to have fluctuating demand.
Moreover, ABC/XYZ analysis can be applied to evaluate customer contributions to the company's profits and growth. For example, you can identify which customer segments generate 80% of the profit and determine whether resources are being allocated effectively. This approach can also be useful in evaluating the performance of retail outlets or any other business element whose contribution to profit needs to be assessed.
The obvious advantages of ABC and XYZ analysis include:
-
Versatility: This analysis can be applied across various business models (B2B, B2C, or B2G) and is not restricted by the size, niche, or characteristics of the business, making it universally applicable.
-
Simplicity and Accessibility: ABC and XYZ analysis require minimal tools and can be easily conducted using software like Google Sheets, Excel, or Power BI - no advanced economic expertise is necessary.
-
Efficiency: This method is considered a foundational tool in strategic business planning. It is a valuable starting point for researching and evaluating a company, providing more accurate forecasts for business income and development.
There are also drawbacks. While useful, ABC/XYZ analysis does have some limitations. First, it requires pre-existing data on sales and profits, meaning it is less effective for startups that do not have sufficient data. Additionally, the analysis lacks detailed insights, overlooks interrelationships between different variables (which must be examined separately), and does not account for market dynamics. As a result, the findings from an analysis performed just a month or two apart may differ significantly, as the method does not consider external factors such as seasonality or economic crises.
How to Conduct ABC Analysis in Practice

ABC/XYZ analysis is done manually, and the only application or service you need for this is Excel.
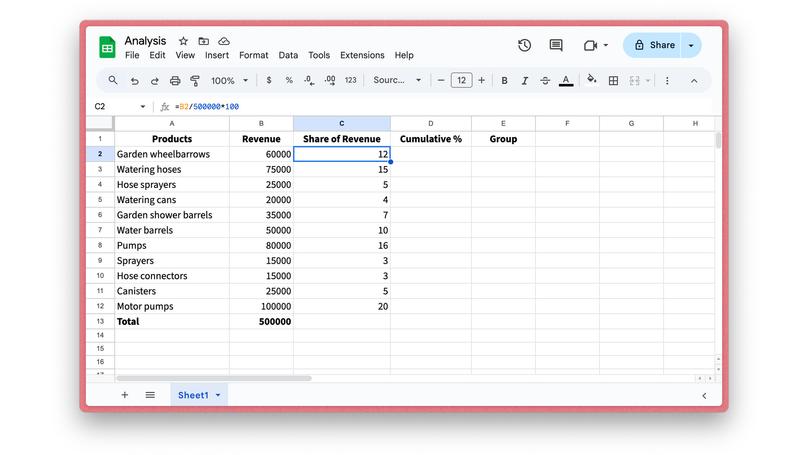
Step 1: Create a table and assign yourself five columns:
-
The first is the name or type of goods;
-
The second is the amount of profit for the month;
-
The third is the share of profit from the total profit of the company. It is calculated using the formula:
Revenue from sales of goods for the period / Total revenue of the company × 100% (or the formula = cell number with the revenue of the goods / total revenue * 100 for Excel); -
The fourth - total percentage;
-
The fifth - assigned group (A, B, or C).
For further calculations, you will also need to know your company's total profit for the month - calculate it in advance and write it down.
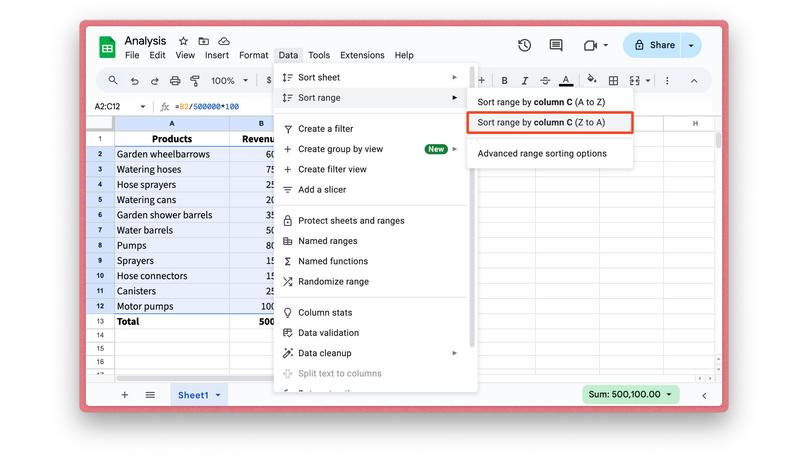
Step 2: Record the known profit of the products and the calculated share of total revenue, and then sort the products in the first column in descending order by "Data" tab - "Sort range" - "Sort range by column C (Z > A)". This will give you a table where you can immediately see the products with the highest percentage of revenue.
Step 3: We calculate the total percentage as a running total in the fourth column. What does this mean? We add the previous shares to each share. Example: in first place are motor pumps with a share of 20% - this will be their total percentage. In second place are pumps with a share of 16%: we add the share of motor pumps to this percentage, and we get 36%. With third place, we add all the previous ones in the same way - we get 51%.
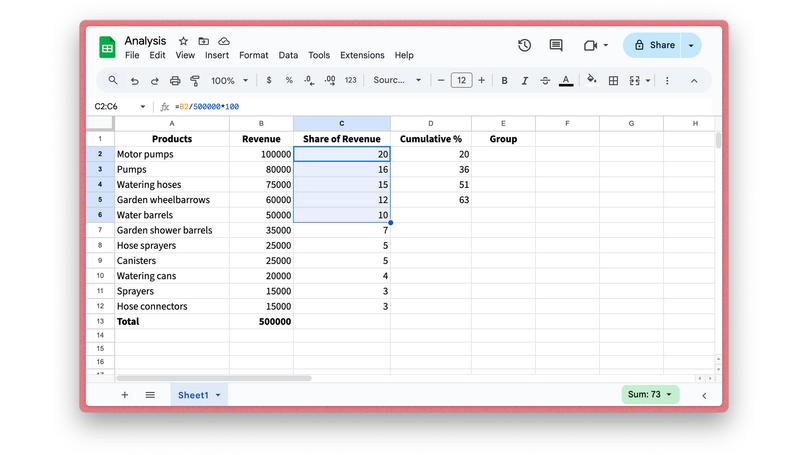
By the last line, the value of the fourth column should be 100%. Check if this is the case.
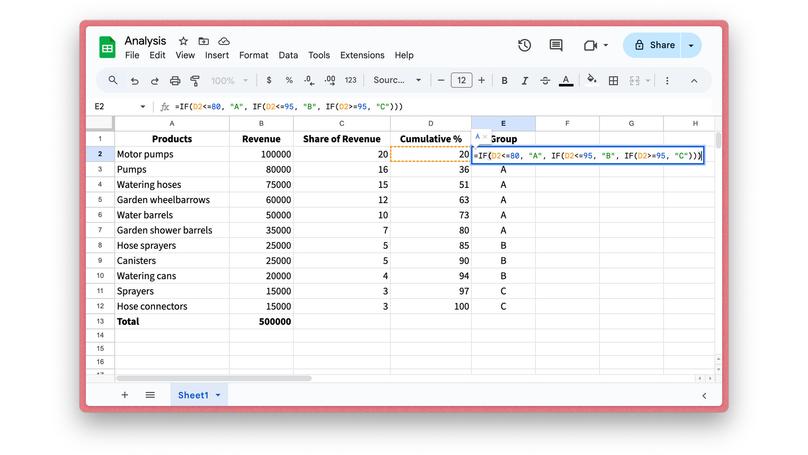
Step 4: Determine the product category depending on the calculations. It is determined by the total percentage as follows:
-
Products with an indicator less than 80% - group A;
-
Products with an indicator of 80-95% - group B;
-
Products with an indicator of 95-100% are group C.
In Excel, this can be calculated using the formula:
=IF(D2<=80;"A";IF(D2<=95;"B";IF(D2>=95;"C")))
Enter it in the first cell with the group and stretch it to the entire table.
Done! Save this table somewhere separately - you can use it later as a template for future analyses.
How to Conduct XYZ Analysis
XYZ analysis also uses Excel, but it will have more columns, though the calculation process itself will take you less time. Create a table for XYZ on a second sheet, so that later you can easily switch between its results and the results of the previous ABC analysis.
Step 1: In the first column, copy and paste the products from the previous sheet. The second column and all subsequent ones are the periods for which you need to calculate the revenue. Make sure that the periods are equal periods of time, for example, by month or quarter (it all depends on the specifics of your business and personal convenience).
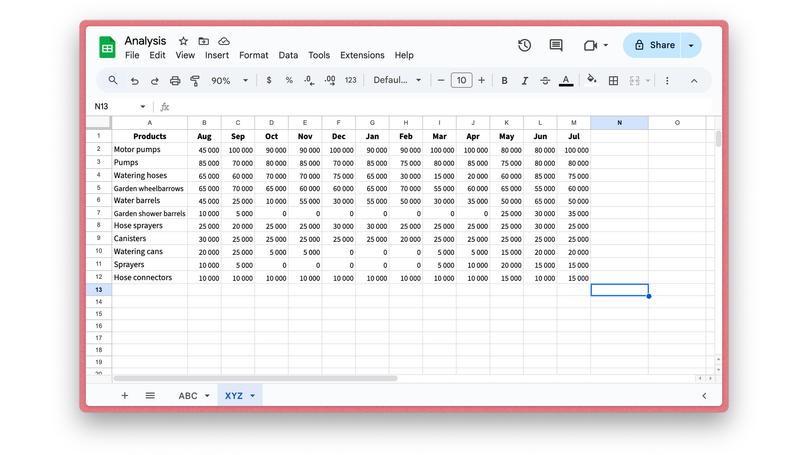
After all the columns with time periods, add a column called "Variation Coefficient," i.e. the degree of deviation from the average value (for example, demand, as we discussed above). Call the very last column "Category" - in it, we will indicate which group (X, Y, or Z) the product ultimately belongs to.
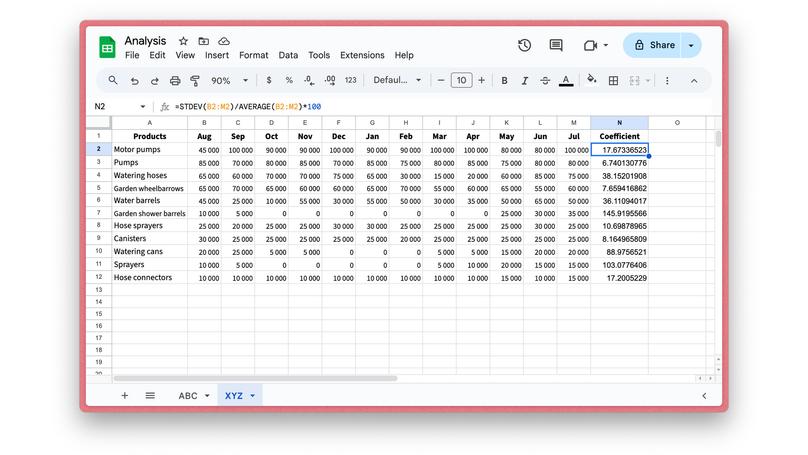
Step 2: Enter the revenue for each product in each period (month) column, then calculate the ratio using the formula:
=STDEV(B2:M2)/AVERAGE(B2:M2)*100
Note that the result will be shown as a percentage, and B2:M2 in the formula are the time ranges you specified (the letters may be different, pay attention to your table).
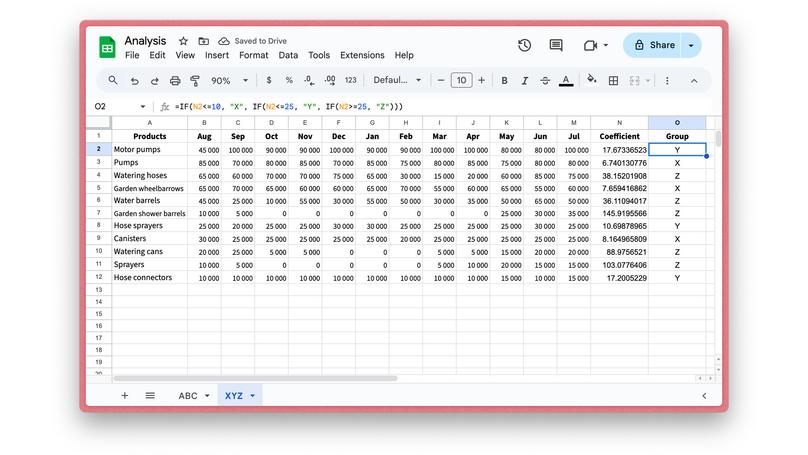
Step 3: Assign each product to a specific category based on the results:
-
Goods with a coefficient of 0-10% go in category X;
-
Goods with a coefficient of 10-25% go in category Y;
-
Goods with a coefficient of more than 25% go in category Z.
You can determine categories automatically in Excel using the formula:
=IF(N2<=10;"X";IF(N2<=25;"Y";IF(N2>=25;"Z")))
The main thing is to remember that you need to specify the number of the cell where you have the variation coefficient. Then stretch the window to cover the entire table.
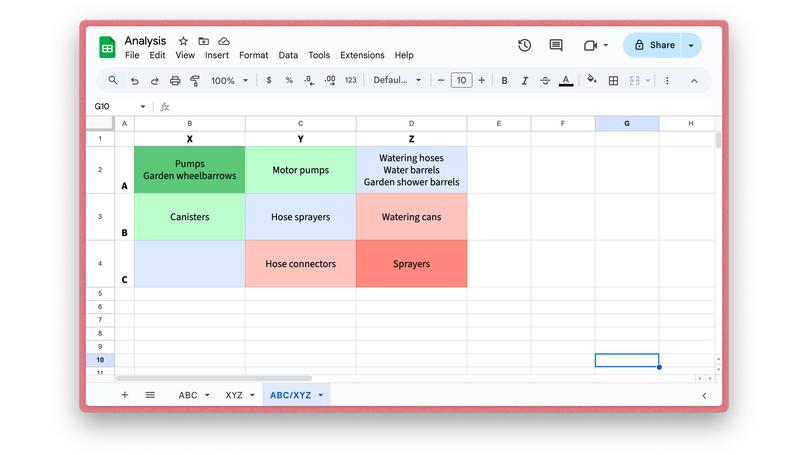
ABC/XYZ Analysis Matrix
Once you have completed ABC analysis and XYZ analysis separately, the data can be "reduced" to each other. The most convenient way to do this is on the basis of the Eisenhower matrix, turning it into an ABC/XYZ analysis matrix: indicate the ABC analysis categories in the rows, and XYZ in the columns. At the intersections, place the corresponding products in the required "squares" and draw conclusions based on the displayed information about the further business strategy.
How to Use the Results of ABC/XYZ Analysis
As mentioned earlier, the strategy for working with products is formed based on the category they are in. But what exactly are you supposed to do with each of them? Here's what:
-
Category A: These products deserve additional promotion, for example, to be included in the mailing list, sent to influencers, connected to push notifications with a purchase reminder, made a separate banner on the site, updated product card, etc. These are the products that are considered flagship in your brand. The more resources you invest here, the better the return will be. Such products, among other things, have a longer life cycle.
-
Category B: You purchase or produce exactly as many goods as necessary to cover the existing demand for them.
-
Category C: Products from this category should be removed from the assortment, their sale should be stopped, or their stock should be reduced and sold as needed or in response to surges in demand (if you have identified a demand pattern, such as seasonality).
-
Category X: Products in X must always be in stock because customers buy them regularly, and if the products are suddenly out of stock, the company's profits will drop sharply. Make sure that their production and new deliveries are timely, and ensure uninterrupted inventory renewal and management.
-
Category Y: These goods are purchased in small quantities, since it makes no sense to store their stocks due to unstable demand.
-
Category Z: These are products that are bought "occasionally", so they can be transferred to sale by pre-order or provided that you collect a sufficient number of pre-paid applications, and only then order a new batch.
For products Y and Z, you also need to conduct additional analysis to identify the factors that influence their demand. This will allow you to more accurately adjust the volumes of products and, perhaps, even increase them. As for the combined categories of ABC/XYZ analysis that you identified based on the matrix, then:
-
AX combination is the most valuable goods, so they should be well promoted and in large quantities in stock. Also, BX generates good revenue. Even a small downtime in sales of both goods will be financially noticeable for the company.
-
Products from AY or BY can be moved to AX with the right demand stimulation through marketing or special display. Just try to place them on the most visible shelves in the store.
-
CZ products require additional analysis. This category includes products whose life cycle has already ended or which have not been sufficiently stimulated, so some of them can also be transferred to higher groups.
-
CX products generate small but stable revenues, and the risks associated with them are easy to manage, so it is worth allocating a small but fixed stock for them. CY products should be acquired or left on a residual basis.
Work with other categories is driven by circumstances, but the main goal is always the same - to try to increase the product category in both ABC and XYZ, and if this is impossible, then minimize its quantity or remove it from the assortment. Also, however, take into account force majeure scenarios and their impact, such as the coronavirus pandemic or legislative innovations in the industry. Here, ABC/XYZ analysis can reflect a short-term, and therefore not entirely reliable, result.
ABC/XYZ Customer Analysis

As mentioned above, ABC/XYZ analysis can also be used to evaluate and categorize a customer base. It is based on the study of purchasing trends and patterns of different customer segments. If your company is looking to become a market leader, expand its target audience, or reduce the costs of servicing and attracting customers properly, leaving only the most effective segments, then ABC/XYZ analysis is for you.
In this case, Category A will include key customers who make purchases most often or purchase for the largest amount. Understanding what these customers look like will help you put together a detailed questionnaire for better segment processing and form a more accurate and attractive USP (Unique Selling Proposition). This, in turn, will increase the probability of a deal and sales funnel conversion, make your sales offers and communication with customers more effective, and therefore, profit will increase. Specifically, ABC/XYZ analysis will help you collect all the data necessary to answer each of these questions:
-
What is the status of your customer base? Are there any discrepancies between the identified segments and offers or share violations? What needs to be improved?
-
Which customers (specific individuals or groups) are strategically important for your business and without whom your profits will plummet? How can you improve your tools for working with them?
-
Who is in client group B, and who can be promoted to A? How can you increase their average bill?
-
What are the weaknesses of your current customer service strategy? Which segment has "fallen" recently, and which has grown and is showing the greatest activity?
Conclusion
ABC analysis and XYZ analysis, despite their simplicity, are still a basic tool for assessing the economic health and efficiency of a company. It is important to remember that these analyses alone will not give you such a deep and useful insight into it as they will together.
This analysis can be adapted to absolutely any objects, be it inventory analysis, assortment analysis (for which it is most often used), or even routine classification of nomenclature. It can also be a study of investments of partners, retail outlets, or even sales representatives.
To adjust strategic business plans, the analysis should be carried out once every six months to a year, but if you need to analyze the impact of seasonality, previously implemented changes, or other factors that have arisen, then once a quarter or every four months.
Do not forget, however, to also connect other assessment tools to identify relationships that ABC/XYZ analysis does not take into account, and additionally analyze its results.